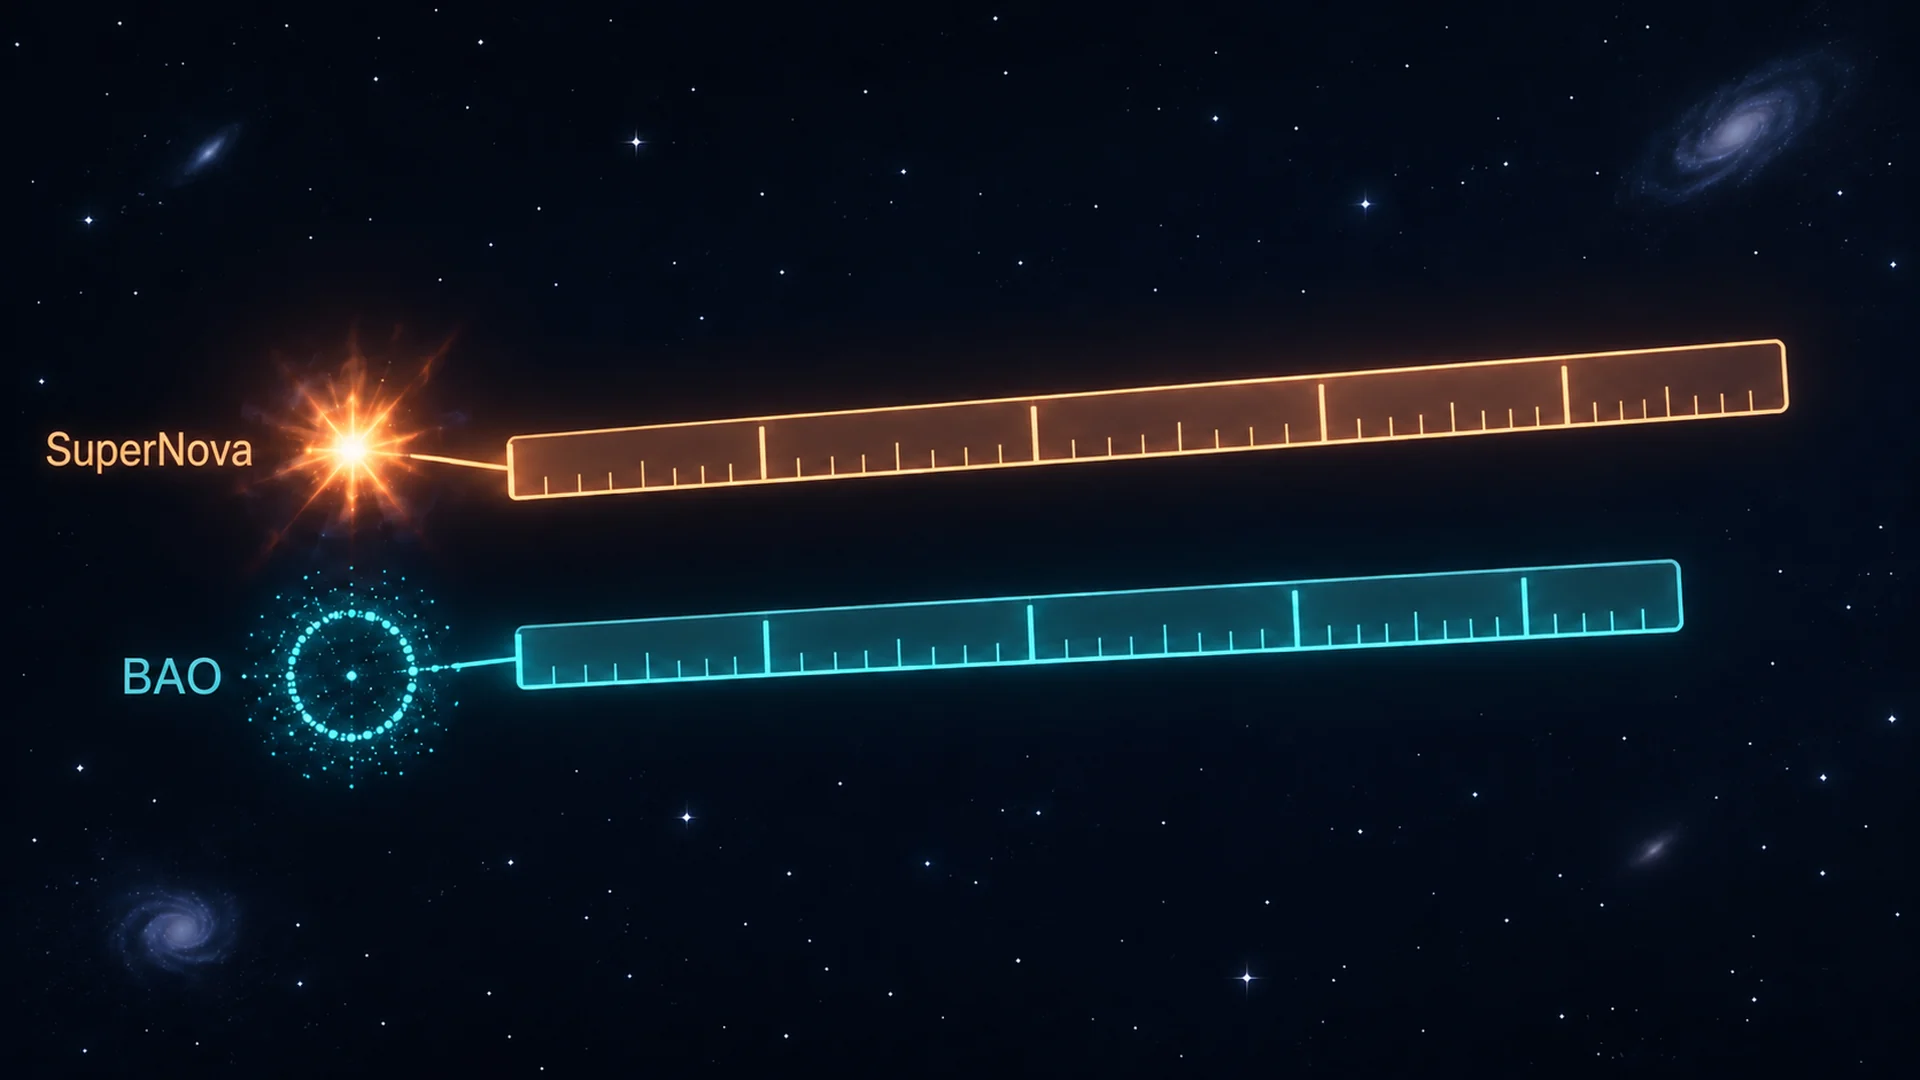
Light from a star that exploded in the distant universe can take billions of years to reach Earth. Astronomers use that light to work out how the universe has expanded.
But a recent reanalysis brought a surprise.
We still do not know exactly what is driving the accelerating expansion of the universe. In the simplest model, an ingredient called dark energy has properties that do not change over time. But observations have raised the possibility that dark energy itself may be changing.
Then astronomers recalibrated the brightness of supernovae they had already observed. The statistical evidence for dark energy changing over time became substantially weaker.1
They had not observed a new set of stars or used a new telescope. They had reanalysed data they already had.
Were we seeing evidence that the universe was changing—or evidence that our way of measuring it was not yet accurate enough?
Supernovae Let Us Measure Distance by Brightness
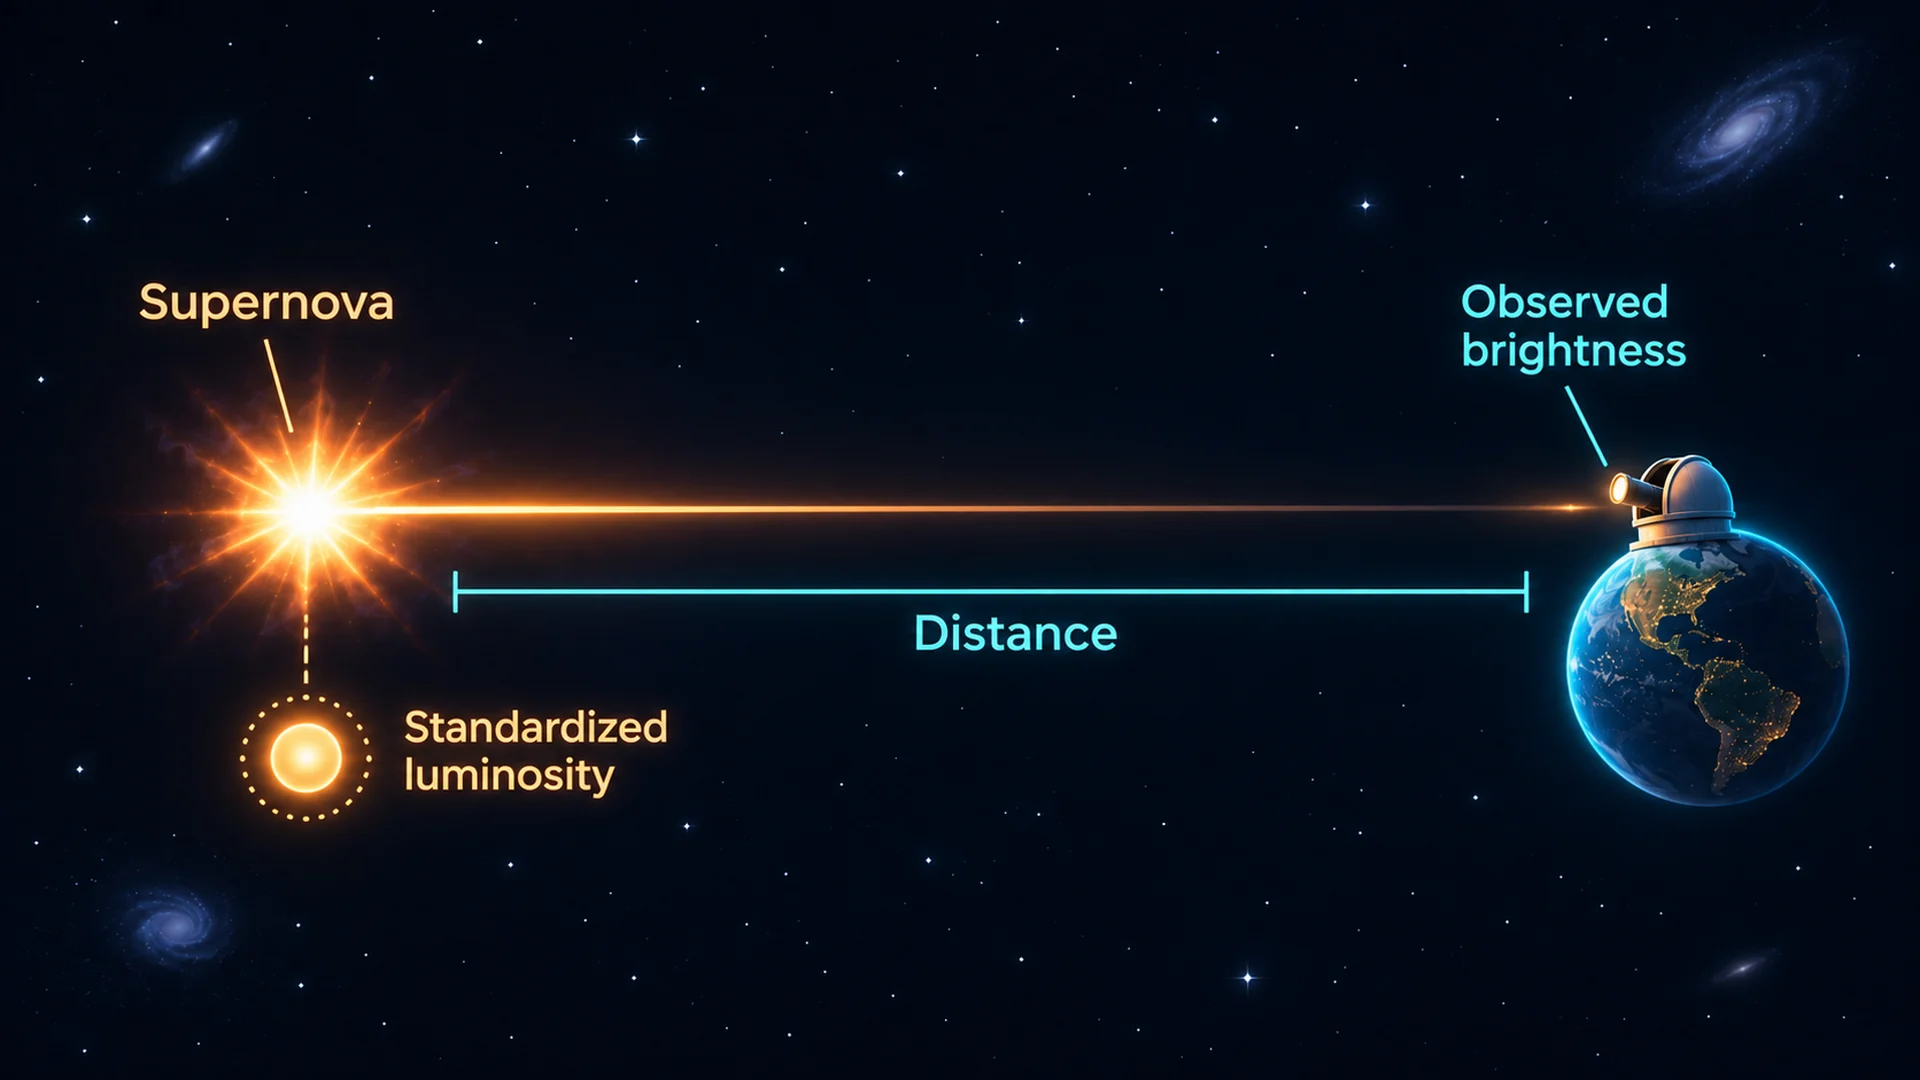
A light source looks fainter the farther away it is. If we know how much light a star originally emitted, we can estimate its distance by comparing that intrinsic brightness with what we see on Earth. Astronomers use a particular kind of stellar explosion, a Type Ia supernova, for this purpose.
In 1998, a team including Adam G. Riess reported that distant Type Ia supernovae appeared dimmer than expected. The following year, an independent team including Saul Perlmutter reached a similar conclusion.2 If the expansion of the universe were governed by the gravity of matter alone, it would be expected to slow over time. But the distances inferred from supernovae did not fit that expectation. They pointed instead to an accelerating expansion.
That inference depends on how accurately we can establish a supernova's intrinsic brightness.
A Type Ia supernova is a runaway thermonuclear explosion involving a white dwarf, a dense remnant left behind by an evolved star. In the traditional scenario, the white dwarf draws matter from a companion until it approaches the Chandrasekhar limit, about 1.4 solar masses, and explodes.3 The expectation that similar conditions would produce similar luminosities laid the foundation for using these explosions as distance indicators.
Yet Type Ia supernovae do not all reach the same peak brightness. Brighter ones generally fade more slowly. Astronomers therefore use the shape of the light curve and the colour of the light to estimate and standardise their intrinsic luminosities.4
Type Ia supernovae are not identical “standard candles”, then, but distance indicators whose brightness can be standardised.
The simplest way to account for cosmic acceleration is to include Einstein's cosmological constant, Λ, in general relativity. Interpreted as an energy component, Λ maintains a constant density as space expands. The model combining Λ with cold dark matter—ΛCDM—became the standard framework for describing the universe's expansion history, or how its rate of expansion has changed with time. Here, “cold” means that the dark matter moves slowly compared with the speed of light.
The Early Universe Left a Distance Scale Behind
Another yardstick for cosmic expansion comes from waves in the early universe.
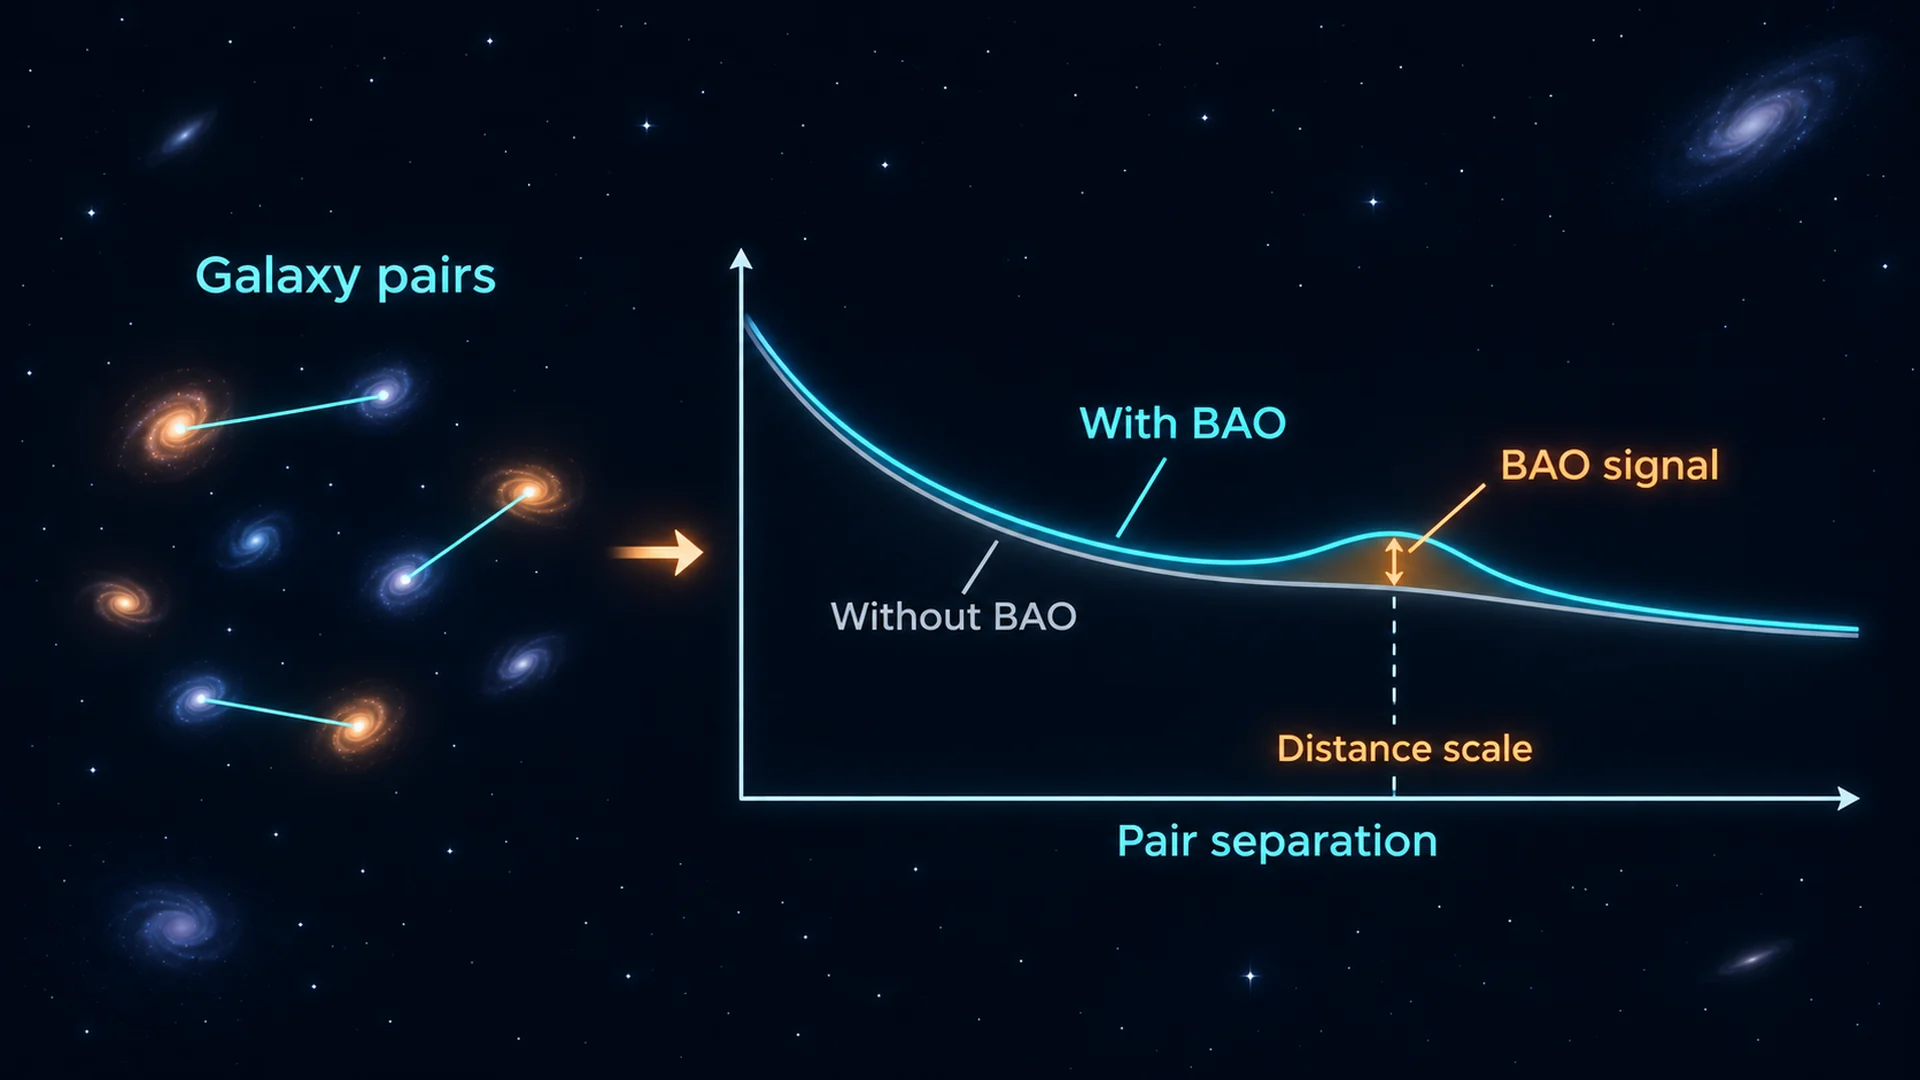
In the young universe, radiation and matter were tightly coupled in a hot plasma. Gravity pulled matter towards denser regions while radiation pressure pushed outwards, sending density disturbances travelling as enormous sound waves. This process is called baryon acoustic oscillation, or BAO.
About 380,000 years after the Big Bang, the universe cooled enough for light to travel freely. The acoustic waves could no longer propagate in the same way, leaving a characteristic scale imprinted on the distribution of matter. The light released at that epoch is what we observe today as the cosmic microwave background, or CMB.
The imprint persisted as galaxies formed: pairs of galaxies are slightly more common at a particular separation. Astronomers use this pattern—the BAO signal—as a distance scale.
The physics of the early universe, together with CMB observations, allows the scale to be estimated. Measuring how that scale appears in galaxy distributions at different epochs helps reconstruct the history of cosmic expansion.
Evolving Dark Energy Differs From a Cosmological Constant
As the universe expands, a given amount of matter spreads through a larger volume and its density falls. Λ behaves differently: its energy density stays constant, so its share of the universe becomes increasingly important as matter thins out.
The suggestion that dark energy “changes” is that it may not behave like Λ. Its density, or the relationship between its pressure and density, could evolve, changing its effect on cosmic expansion.5
Astronomers test this by fitting supernova, BAO and CMB observations to two kinds of model: ΛCDM, in which dark energy behaves as a constant, and a model that allows it to evolve over time.
DESI Compared the Models
The Dark Energy Spectroscopic Instrument (DESI) analyses light from thousands of celestial objects at once, separating it into wavelengths. Researchers measure how the expansion of the universe has stretched the light from galaxies and quasars—distant galaxies with exceptionally bright central regions. From these redshifts and the objects' positions on the sky, they map their three-dimensional distribution and search for the BAO pattern.
In 2025, the DESI collaboration used the first three years of observations to measure BAO and compare cosmological models.6 BAO data alone were consistent with ΛCDM. But when CMB observations were added, a model allowing dark energy to evolve fit the combined data better, with a reported difference of 3.1σ.
Here, σ (sigma) expresses the statistical difference in model fit. A larger value means that the distinction is more pronounced for the data and assumptions used.7
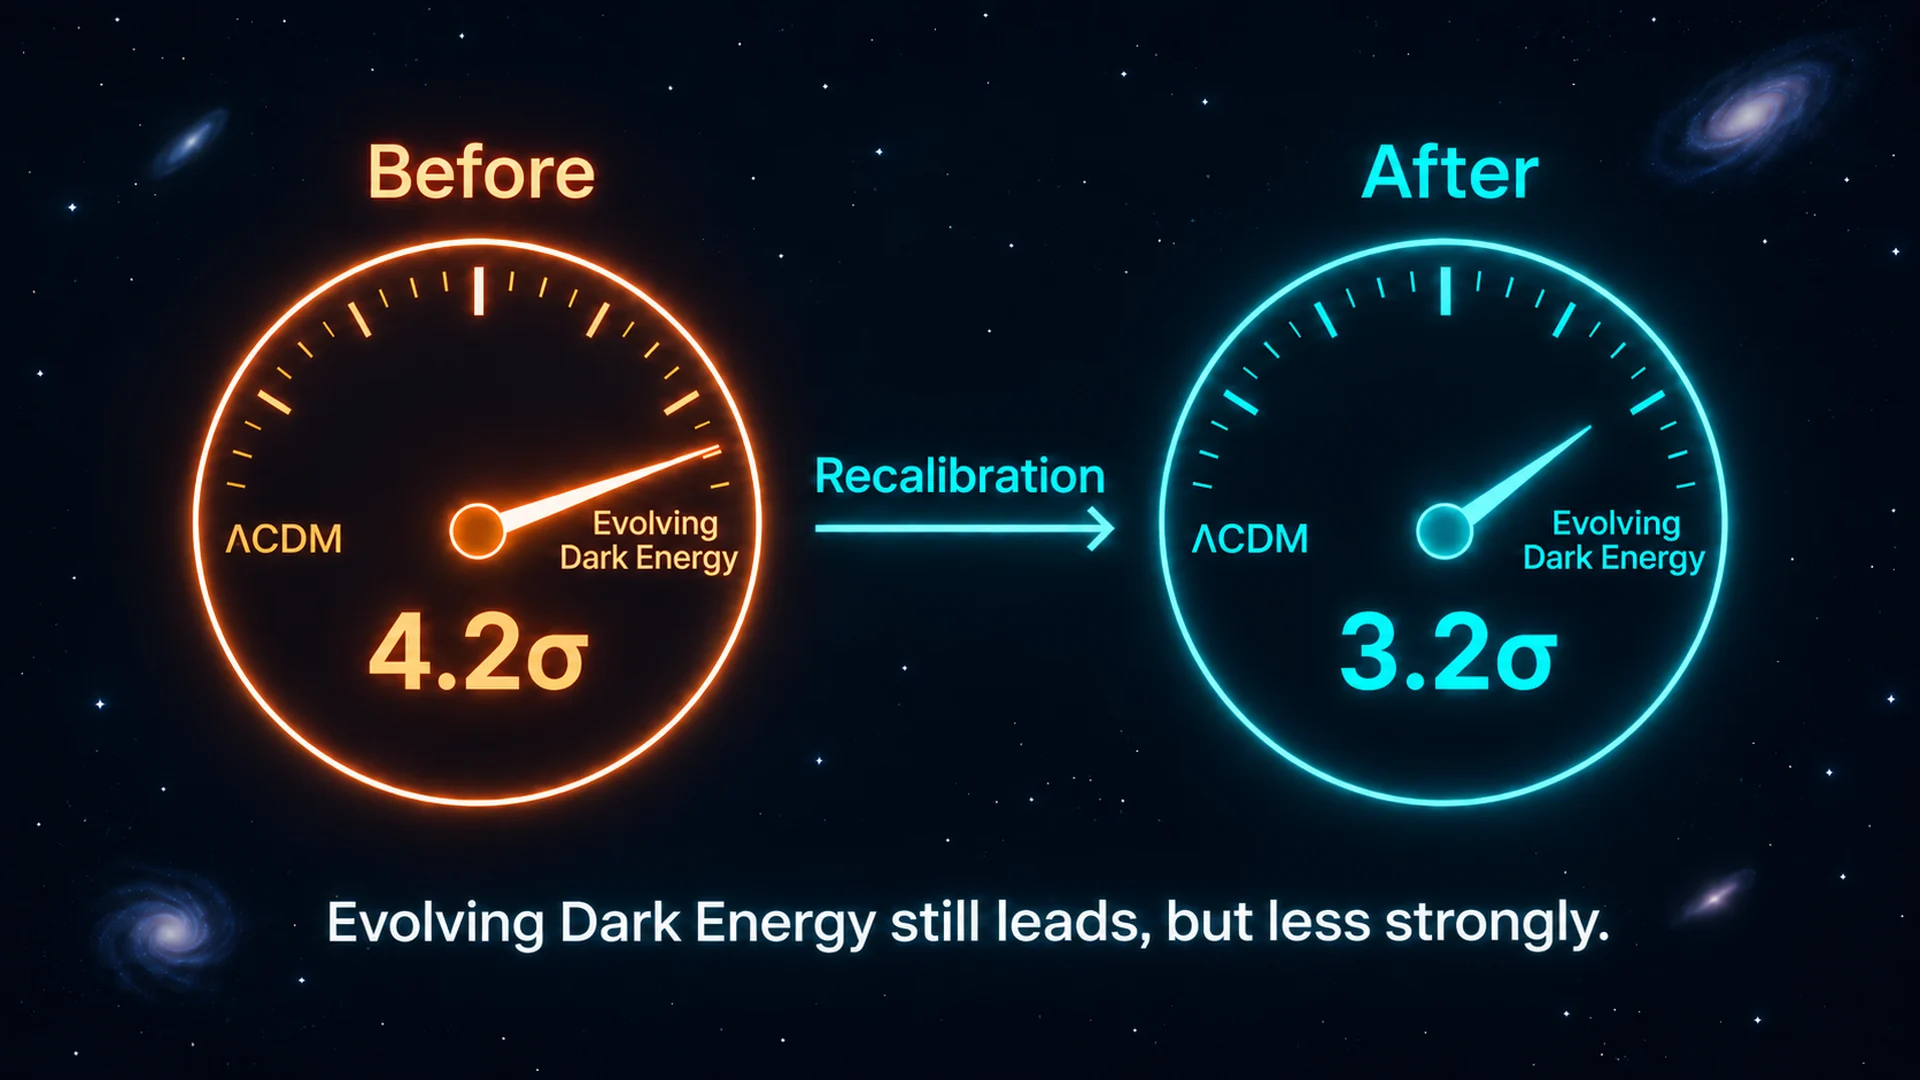
Adding supernova observations changed the result considerably. With the Pantheon+ supernova compilation, the difference was 2.8σ; with Union3, 3.8σ; and with five years of supernova data from the Dark Energy Survey, 4.2σ.6
The DESI BAO and CMB measurements were the same. What changed was the supernova compilation—and the way its distance scale had been established.
The Supernova Distance Scale Is Still Contested
In 2026, the Dark Energy Survey (DES) collaboration reanalysed its five-year supernova sample.1 DES is a separate observing programme from DESI; this study used the brightness and distances of Type Ia supernovae.
After revising the brightness calibration between instruments and the supernova standardisation procedure, the reported difference between the two cosmological models fell from 4.2σ to 3.2σ. It was a recalibration of existing observations, not a substantial influx of newly observed supernovae.
In a follow-up study published in September 2026, a researcher tested what happened when nearby supernovae were progressively removed from the analysis.8 With the recalibrated DES-Dovekie sample, the difference between evolving dark energy and ΛCDM diminished rapidly.
With Pantheon+ and the original five-year DES sample, however, a difference of roughly 2σ remained even after all supernovae at redshifts of 0.12 or less were excluded. The study left two possibilities open: a real change in dark energy, or a supernova standardisation issue not resolved by brightness calibration alone.8
Another DES analysis found that, within ΛCDM, BAO and supernova observations yielded different estimates of the universe's matter density.9 The discrepancy could reflect a systematic error—a bias introduced by observing or calibrating data—or a limitation of ΛCDM. Its cause remains unresolved.
One possible source of distance bias is the age of the star before it became a supernova. In 2025, a team including Junhyuk Son, Young-Wook Lee and Chul Chung reported a relationship between the age of a supernova's progenitor star and its brightness, even after conventional standardisation.10 If the progenitors of nearby and distant supernovae differ in average age, an intrinsic difference in brightness could be mistaken for a difference in distance.
Applying their age correction brought the supernova data closer to the evolving-dark-energy model inferred from DESI and the CMB in 2025. On the basis of their combined model fits, the researchers also raised the possibility that the universe's present-day accelerated expansion has ended.10
They also compared supernovae hosted by similarly young galaxies observed at different epochs, calling this an “evolution-free” test. They reported that this sample, too, fit the evolving-dark-energy model used in the earlier DESI analysis better than ΛCDM.10
In 2026, a team including Phil Wiseman and Adam G. Riess countered that existing supernova analyses already account for much of the age-related effect and that the proposed age difference between nearby and distant progenitors had been overstated.11
Chul Chung, Junhyuk Son and Young-Wook Lee and colleagues responded that grouping supernovae into broad redshift intervals can artificially weaken the apparent relationship between age and brightness. They also argued that a smaller age difference would imply a larger luminosity change per unit age, leaving the total inferred correction broadly similar.12
Extracting More Distance Information From Existing Data
Instead of recalibrating supernova brightness, researchers can extract more geometric information from observations they already have. As light from distant quasars travels towards Earth, neutral hydrogen at many points along the way absorbs selected wavelengths. The overlapping absorption features form what astronomers call the Lyman-alpha forest. Combining these patterns from many quasars traces the distribution of matter roughly 11 billion years ago.
DESI had already used these data to measure the characteristic BAO separation. In 2026, the collaboration also analysed how the absorption pattern appears along the line of sight compared with the transverse direction, extracting additional distance information.13
The resulting model fits moved closer to ΛCDM. The difference between ΛCDM and evolving dark energy was 2.7σ for DESI plus CMB, and 3.2σ when supernovae were also included.13
The DESI team tested its methods against hundreds of simulated datasets with known input cosmologies.14 The distance-related measurements passed the validation tests. A bias was found in one measure related to the growth of cosmic structure, so that measurement was excluded from the final analysis.
Bringing Supernova Samples onto One Scale
Could supernovae observed by different telescopes and surveys give more consistent results if analysed using one common procedure?
In September 2026, a team including Ryan Camilleri released a preprint of Unite, an analysis combining the Pantheon+ and five-year DES supernova compilations. After resolving overlapping observations and harmonising selection and brightness-standardisation methods, they analysed 2,884 likely Type Ia supernovae.15
Combined with BAO and CMB observations, Unite yielded differences in model fit of 3.3σ or 3.1σ, depending on the estimation method. But a Bayesian comparison, which also accounts for the additional adjustable parameters a model allows, provided only weak evidence in favour of evolving dark energy.15
Galaxy Shapes Offer Another Test
The distribution of matter across the universe provides another check on its expansion history. Matter along the line of sight bends the light from distant galaxies. By analysing correlated distortions in the apparent shapes of many galaxies, astronomers trace how matter has clustered over time. This is known as weak gravitational lensing.
Using six years of observations, the DES collaboration analysed the shapes of 140 million distant source galaxies and the positions of 9 million foreground galaxies. The study first appeared as a preprint in January 2026 and was accepted by a journal on November 2.16
The researchers combined these measurements with supernova, BAO, galaxy-cluster and CMB observations. Assuming that the relationship between dark energy's pressure and density remained constant over time, they obtained w = −0.981 (an uncertainty of about ±0.02). This was not statistically distinguishable from w = −1, the value for a cosmological constant.16
In a separate study released in May 2026, DES instead allowed w to vary with time. Combining supernova, BAO, weak-lensing and galaxy-clustering data with DESI BAO and CMB observations yielded a 3.0σ difference in fit between an evolving-dark-energy model and ΛCDM.17
The studies tested different assumptions. One held w constant; the other allowed w to evolve, and their combinations of observations were not identical.
Check the Cosmic Rulers Before Drawing Conclusions
With some combinations of observations, an evolving-dark-energy model fits better than ΛCDM. But the size of that difference depends on the supernova sample and its calibration, the possible effects of progenitor age, and which information researchers extract from their observations.
To determine whether dark energy truly changes, we first need to establish whether our different cosmic rulers describe the same history of expansion.
Keep reading CAUSIFOLD
Follow new CAUSIFOLD articles and updates on Substack.
Subscribe on Substack ↗Notes
1. DES Collaboration, “The Dark Energy Survey supernova program: a reanalysis of cosmology results and evidence for evolving dark energy with an updated Type Ia supernova calibration,” Monthly Notices of the Royal Astronomical Society 548, stag632 (2026), DOI 10.1093/mnras/stag632. Updated cross-calibration of photometry, white-dwarf reference calibration, SALT3 retraining and numerical procedures reduced the reported difference from 4.2σ to 3.2σ.
2. Adam G. Riess et al., “Observational Evidence from Supernovae for an Accelerating Universe and a Cosmological Constant,” The Astronomical Journal 116, 1009–1038 (1998), DOI 10.1086/300499. The paper came from the High-z Supernova Search Team led by Brian P. Schmidt. Saul Perlmutter et al., “Measurements of Ω and Λ from 42 High-Redshift Supernovae,” The Astrophysical Journal 517, 565–586 (1999), DOI 10.1086/307221.
3. A carbon–oxygen white dwarf exploding near the Chandrasekhar mass is the traditional Type Ia scenario; see W. David Arnett, David Branch & J. Craig Wheeler, Nature 314, 337–338 (1985). Other pathways, including explosions below the Chandrasekhar mass, remain subjects of research. Nature (1985)
4. Type Ia supernovae do not share a single peak luminosity. Light-curve width and colour are among the quantities used for standardisation. D. Andrew Howell, “Type Ia supernovae as stellar endpoints and cosmological tools,” Nature Communications 2, 350 (2011), DOI 10.1038/ncomms1344.
5. The relationship between dark-energy density and pressure is expressed using an equation-of-state parameter, w; Λ corresponds to w = −1. The representative time-varying form used in DESI analyses is w(a) = w₀ + wₐ(1 − a). These are parameters describing expansion history, not names of particular particles or fields. M. Chevallier & D. Polarski, International Journal of Modern Physics D 10, 213 (2001), DOI 10.1142/S0218271801000822; E. V. Linder, Physical Review Letters 90, 091301 (2003), DOI 10.1103/PhysRevLett.90.091301.
6. M. Abdul Karim et al. (DESI Collaboration), “DESI DR2 results. II. Measurements of baryon acoustic oscillations and cosmological constraints,” Physical Review D 112, 083515 (2025), DOI 10.1103/tr6y-kpc6. Reported model-fit differences: DESI BAO + CMB 3.1σ; with Pantheon+ 2.8σ; with Union3 3.8σ; with DES-SN5YR 4.2σ. These are distinct combinations, not a single overall significance or the probability that dark energy changes.
7. The reported σ values express model-fit comparisons on a normal-distribution scale; they are not probabilities that a given model is true or false. As illustrative two-sided normal-tail equivalents, 3.1σ ≈ 0.19%, 3.2σ ≈ 0.14% and 4.2σ ≈ 0.0027%. These conversions must not be treated as the actual p-values of different analyses without their respective test assumptions. DESI DR2
8. Tao Zhang, “A Truncation Test of the DESI Evolving Dark Energy Signal: Three Supernova Calibrations Compared,” Monthly Notices of the Royal Astronomical Society 552(4), stag1868 (2026; published online September 30, typeset October 14), DOI 10.1093/mnras/stag1868. Progressively excludes nearby supernovae from Pantheon+, DESY5 and DES-Dovekie. The difference weakens substantially for DES-Dovekie, while approximately 2σ remains for Pantheon+ and DESY5 after removing objects at z ≤ 0.12. The author leaves open both physical evolution and an unresolved standardisation effect shared across samples.
9. T. M. C. Abbott et al. (DES Collaboration), Physical Review D 113, 063530 (2026), DOI 10.1103/z2q4-qcdq. Within ΛCDM, DES BAO and supernova measurements indicated differing matter-density estimates. The study did not settle whether this reflected systematics or limitations of ΛCDM.
10. Junhyuk Son, Young-Wook Lee, Chul Chung, Seunghyun Park & Hyejeon Cho, “Strong progenitor age bias in supernova cosmology – II. Alignment with DESI BAO and signs of a non-accelerating universe,” Monthly Notices of the Royal Astronomical Society 544, 975–987 (2025), DOI 10.1093/mnras/staf1685. The team reported a progenitor-age relationship after standardisation, an age correction varying with redshift and an “evolution-free” comparison restricted to supernovae in similarly young host galaxies. Its inference that present cosmic acceleration may have ceased comes from model fits. The comparison sample is small, and host-galaxy age is a proxy, not a direct measurement of progenitor age.
11. Phil Wiseman, Brodie Popovic, Mark Sullivan, Adam G. Riess et al., “Still accelerating: type Ia supernova cosmology is robust to host galaxy age evolution,” Monthly Notices of the Royal Astronomical Society 549, stag797 (2026), DOI 10.1093/mnras/stag797.
12. Chul Chung, Junhyuk Son, Seunghyun Park, Suk-Jin Yoon, Hyejeon Cho, Dongwook Lim & Young-Wook Lee, “Still non-accelerating: age-bias correction in supernova cosmology is robust to host–progenitor age mapping,” Monthly Notices of the Royal Astronomical Society 551, stag1513 (2026), DOI 10.1093/mnras/stag1513.
13. DESI Collaboration, “DESI DR2 Results IV: Alcock–Paczyński Measurements from the Lyman Alpha Forest and Cosmological Constraints,” arXiv:2607.27410. Preprint status as recorded October 2, 2026. Uses geometric information in the full Lyman-alpha correlation function, in addition to the BAO feature in the same DR2 data.
14. M. Herbold et al. (DESI Collaboration), “Validation of the DESI DR2 Lyα forest full-shape analysis,” arXiv:2607.27411. Preprint status as recorded October 2, 2026. Hundreds of simulations passed the validation standard for BAO and distance-related measures; a measure associated with structure growth was excluded after a bias was detected.
15. Ryan Camilleri et al., “Supernovae Unite: Combining Pantheon+ and DES-SN5YR,” arXiv:2609.05053v2 (revised September 9, 2026; submitted to Publications of the Astronomical Society of Australia; journal publication unconfirmed as of November 9, 2026), https://arxiv.org/abs/2609.05053. The analysis combines 2,884 likely Type Ia objects, harmonising light-curve modelling, selection, bias correction and host-galaxy mass estimates. For Unite + BAO + CMB, the evolving w₀–wₐ model differs from ΛCDM by 3.3σ using maximum a posteriori (MAP) estimates and 3.1σ using maximum likelihood (ML); Bayesian evidence is weak. The 2.5σ MAP figure from v1 was corrected in v2. The authors plan to release the Hubble diagram and likelihood after journal acceptance; this report does not claim independent numerical reproduction. The reused supernovae make Unite non-independent of earlier samples.
16. T. M. C. Abbott et al. (DES Collaboration), “Dark Energy Survey year 6 results: Cosmological constraints from galaxy clustering and weak lensing,” arXiv:2601.14559 (first posted January 21, 2026), accepted by Physical Review D November 2, 2026, DOI 10.1103/nnlj-gyr2, https://doi.org/10.1103/nnlj-gyr2. Uses 140 million source-galaxy shapes and 9 million lens-galaxy positions. A combined analysis with constant w obtains w = −0.981 (+0.021/−0.022), with no significant improvement over ΛCDM. November 2 is the acceptance date, not the first release of the preprint.
17. DES Collaboration, “Constraints on Dynamical Dark Energy from Multiple Probes in the Full Dark Energy Survey,” arXiv:2605.27221 (2026; listed as “to appear in PRL” by DES as of November 9), https://arxiv.org/abs/2605.27221; DES papers page: https://www.darkenergysurvey.org/des-y6-cosmology-results-papers/. With evolving w(a) = w₀ + wₐ(1 − a), combining supernovae, BAO, lensing, clustering and CMB yields a 3.0σ difference from ΛCDM; removing supernovae yields 2.6σ. This is not the same model or data combination as the constant-w test in [16].